Infectious Diseases & Immunity
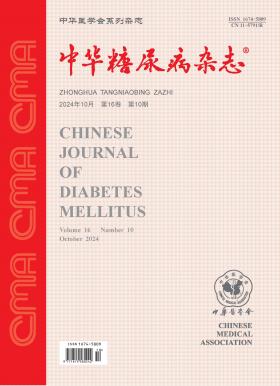
Volume 16 · Issue 10 · 2024
Infect Dis Immun
- Sections
- Special Article
- Criterion and Guide
- Original Article
- Review Article
At present, diabetes is showing a rapid growth trend all over the world, and the phenomenon of abnormal blood sugar in hospitalized patients is very common. However, due to the barriers between departments and the lack of information, there are high prevalence and low detection rate of non-endocrinology patients with abnormal blood sugar. Rate, low management rate, low control rate, etc. In order to further optimize the blood glucose management mode of the whole hospital, Shanxi Provincial People's Hospital has opened a new practice of information-based blood glucose management led by endocrinology department, aiming at controlling the blood glucose level of hospitalized patients, formulating individualized plans for patients with abnormal blood glucose, improving patient prognosis, shortening the average hospital stay of patients, improving patient satisfaction, and meeting the homogeneous comprehensive management needs of non-endocrinology diabetes.
Type 1 diabetes (T1DM) is the main type of diabetes in children and adolescents, which seriously endangers children's health and affects patients' learning in school. It is of great significance to carry out the management of T1DM in school. The Type 1 Diabetes Group of Diabetes Branch of Chinese Medical Association and the compiling committee of the School Management Manual of Chinese Type 1 Diabetes Patients jointly compiled the School Management Manual of Chinese Type 1 Diabetes Patients, which focused on the management objectives of T1DM patients, school diet and exercise management, high/hypoglycemia treatment and emergency disaster recovery, and school management filing and communication, aiming at guiding medical staff, parents of patients and school teachers to standardize the school management of T1DM and help T1DM patients spend their campus life smoothly.
To investigate the characteristics of continuous glucose monitoring (CGM) in type 1 diabetic patients with fast-glycator phenotype.
This was a cross-sectional retrospective study. Patients diagnosed with type 1 diabetes mellitus (T1DM) and wearing CGM for 10 d and more from the T1DM-specific Disease Clinic, the Second Xiangya Hospital of Central South University were enrolled from April 2017 to August 2023 to collect laboratory glycated hemoglobin A1c (HbA1c). Calculation of CGM parameters including time in range (TIR), mean blood glucose (MBG) and mean amplitude of glucose excursions (MAGE), are derived from the data collected by CGM devices worn by the participants. Based on the results of MBG, the estimated HbA1c was calculated, and then the hemoglobin glycation index (HGI) was computed by comparing the laboratory HbA1c with the MBG-estimated HbA1c. Patients were divided into non-fast glycator phenotype group (HGI≤0.4) and fast-glycator phenotype group (HGI>0.4). Comparison of differences between groups using two independent samples t-test or Mann-Whitney U test.
We included 377 patients with T1DM, of whom 299 were in the non-fast glycator phenotype group and 78 in the fast-glycator phenotype group. Individuals with fast-glycator phenotype exhibited poorer glycemic control compared to those with non-fast glycator phenotype, as evidenced by higher HbA1c levels [(8.53±1.41) % vs. (6.95±0.90)%, P<0.001], lower TIR [(61.36±15.81) % vs. (67.31±18.31) %, P=0.010], and higher MAGE [(8.01±2.06) mmol/L vs. (7.37±2.38) mmol/L, P=0.015]. However, in patients with suboptimal HbA1c, CGM parameters showed inconsistent changes with HbA1c in fast glycation group, with CGM parameters demonstrating better glycemic control than those in the non-fast glycation group, characterized by higher level of TIR [(61.34±16.3)% vs. (51.99±16.3%)%, P<0.001] and lower level of MAGE [(8.10±2.09) mmol/L vs. (9.23±2.11) mmol/L, P=0.001].
T1DM in fast-glycator phenotype group had worse glycemic control than the non-fast glycator phenotype group, and exhibited inconsistencies between CGM parameters and HbA1c.
To investigate the relationship between different lipid profiles and renal function in type 2 diabetes mellitus (T2DM) patients.
This was a cross-sectional retrospective study. Clinical data were collected from 2 784 T2DM patients who were hospitalized at the Department of Endocrinology, the Third Affiliated Hospital of Sun Yat-sen University from January 2016 to December 2018. These clinical data included age, smoking history, history of alcohol use, history of drug use, disease course, body mass index (BMI), glycated hemoglobin A1c (HbA1c), fasting plasma glucose (FPG), low-density lipoprotein cholesterol (LDL-C), high-density lipoprotein cholesterol (HDL-C), triglycerides (TG), and lipoprotein (a) [Lp (a)], estimated glomerular filtration rate (eGFR) and urinary albumin to creatinine ratio (UACR). LDL-C, HDL-C, TG and LP(a) were used as cluster variables for second-order cluster analysis (K=4). Then the clinical characteristics of each subgroup were analyzed, and biochemical indicators related to renal function such as eGFR and UACR among T2DM patients of different subtypes were compared by one-way analysis of variance(ANOVA), non-parametric test, or χ2 test. Finally, binary logistic regression analysis was used to assess the association between different lipid profiles and the prevalence of diabetic kidney disease (DKD).
The T2DM patients were classified into 4 subtypes by second-order cluster analysis: serum lipids of the patients in cluster 1 were relatively normal and 1 602 patients were included; patients in cluster 2 were characterized by the remarkable increase of Lp(a) [648.5 (455.5, 955.7) mg/L] and 243 cases were included, who had the oldest age, the longest duration of diabetes and the highest level of HbA1c (P<0.05); the patients in cluster 3 were characterized by elevated TG [2.66 (2.05, 4.20) mmol/L] and low HDL-C [(0.87±0.19) mmol/L] levels and 472 patients were included, with the majority being male patients with a high prevalence of smoking and alcohol consumption (P<0.01); patients in cluster 4 exhibited predominantly high levels of LDL-C [(3.85±0.91) mmol/L], including 467 patients with the highest BMI and FPG (P<0.001). Further analysis showed that patients with subtypes 2 to 4 had decreased eGFR levels and/or increased UACR levels compared with subtype 1 and patients with subtype 2 had the lowest eGFR[(59.38±30.21) ml·min-¹·(1.73 m²)-1] and the highest UACR [12.46 (6.99, 27.59) mg/g] level (P<0.01). Logistic regression analysis of each subtype and DKD showed that compared with cluster 1, only cluster 2 was significantly associated with DKD, and the risk of DKD in this subtype increased by 0.98 times [OR value 1.98 (95%CI 1.04-3.80), P=0.039] after adjusting for various confounding factors and medications.
In this study, second-order cluster analysis showed that T2DM patients had different blood lipid profile subtypes. The subtype characterized by elevated Lp(a) levels (cluster 2) exhibited the most severe renal function impairment, which was associated with an increased risk of DKD.
To evaluate the ability of non-invasive anthropometric indices to identify metabolically abnormal but normal weight (MANW) individuals.
This was a cross-sectional retrospective study. The study population included participants aged 20 years and older with a normal body mass index (BMI) (18.5 kg/m²≤BMI<24 kg/m²) from the China National Diabetes and Metabolic Disorders Study between 2007 and 2008. Several non-invasive anthropometric indices, including waist circumference (WC), BMI, waist-to-height ratio (WHtR), waist-to-hip ratio (WHR), a body shape index (ABSI), and body roundness index (BRI), were collected or calculated and grouped into quartiles. Participants were categorized into metabolically normal and normal weight (MNNW) and MANW groups based on BMI and metabolic status. Differences between groups were compared using Student′s t-test, Mann-Whitney U test, or chi-square test. Logistic regression models were used to examine the associations between anthropometric indices and MANW. Receiver operating characteristic (ROC) curves and the area under the curve (AUC) analyses were performed to evaluate the diagnostic value of these indices for identifying MANW.
A total of 15, 937 participants were included (5 657 men and 10 280 women). The prevalence of MANW was 22.2% (3 538/15 937) in the overall population. All six non-invasive anthropometric indices were significantly higher in the MANW group than in the MNNW group (P<0.05). Multivariable logistic regression analyses showed that all six anthropometric indices were influential factors for MANW (P<0.001) after adjusting for age, sex, cigarette smoking, alcohol drinking, ethnicity, educational background, residential area, and leisure-time physical activity. WHtR and BRI had the largest AUC values in both men (AUC=0.643, 95%CI 0.631-0.656) and women (AUC=0.679, 95%CI 0.670-0.688). In the overall population, each standard deviation (SD) increase in WHtR (OR=1.59, 95%CI 1.53-1.66) and BRI (OR=1.56, 95%CI 1.50-1.63) were significantly associated with MANW. Subgroup analyses further confirmed the associations between WHtR and BRI, and the presence of MANW.
Even among those with a normal weight, some are metabolically abnormal. BMI, WC, WHR, WHtR, ABSI, and BRI are positively associated with the presence of MANW. Given its ease of use in clinical practice and epidemiological surveys, WHtR could be a potentially effective factor for screening MANW individuals.
To investigate the factors associated with the occurrence of abnormal glucose metabolism in patients with metabolic associated fatty liver disease (MAFLD).
This was a cross-sectional study. A total of 404 patients with MAFLD biopsies who attended Zhejiang Provincial People′s Hospital and Affiliated Hospital of Hangzhou Normal University from January 2010 to December 2022 were included. General information and laboratory indices. According to the blood glucose status, the group was divided into normal glucose metabolism group and abnormal glucose metabolism group. Clinical factors associated with abnormal glucose metabolism in patients with MAFLD were determined using single-factor and multifactor logistic regression analysis. Stepwise logistic regression analysis was used to determine the independent correlation between abnormal glucose metabolism and the severity of different pathological tissues in MAFLD patients.
A total of 132 of 404 patients (32.7%) had abnormal glucose metabolism. Abnormal glucose metabolism was present in 49.2% (65/132) of patients with nonalcoholic fatty liver (NAFL) and 50.8% (67/132) of patients with suspected or confirmed metabolic dysfunction-associated steatohepatitis (MASH) (P<0.001). Hepatic steatosis, ballooning, and intralobular inflammation were significantly higher in the abnormal glucose metabolism group compared with the normal glucose metabolism group (all P<0.05). Multifactorial logistic regression analysis showed that age (OR=1.037, 95%CI 1.009-1.068), body mass index (OR=1.090, 95%CI 1.035-1.148) and hepatitis B surface antigen (HbsAg) positivity (OR=0.561, 95%CI 0.327-0.912) were associated with abnormal glucose metabolism in patients with MAFLD associated (all P<0.05). According to the results of pathological stratification, the risk of abnormal glucose metabolism in MASH patients was 1.235 times higher than that in patients with NAFL (OR=2.235,95%CI 1.342-3.722,P<0.05), but there was no association between intralobular inflammation or fibrosis and abnormal glucose metabolism in MAFLD patients (P>0.05). Compared with the MAFLD group, those with MAFLD with chronic hepatitis B virus (HBV) infection had relatively less steatosis, less MASH, and more significant liver fibrosis (P<0.05). After correction for pathology-related confounders, the risk of abnormal glucose metabolism remained lower in patients with MAFLD with chronic HBV infection compared with those with MAFLD (OR=0.523, 95%CI 0.318-0.858, P=0.010). Further stratification of the severity of liver fibrosis in patients with MAFLD combined with chronic HBV infection revealed that patients in the stage F1 and F2 had a lower risk of abnormal glucose metabolism compared to the stage F0 (OR=0.200, 95%CI 0.044-0.915, P=0.038; OR=0.190, 95%CI 0.038-0.959, P=0.044). However, it was not associated with the risk of abnormal glucose metabolism when liver fibrosis reached stages F3 and F4 (P>0.05).
The occurrence of abnormal glucose metabolism in MAFLD patients may be related to age, body mass index, and HBsAg positivity. Among these, chronic HBV infection was negatively associated with the risk of abnormal glucose metabolism in patients with MAFLD.
To investigate the correlation between serum uric acid levels and bone mineral density (BMD) in postmenopausal women with type 2 diabetes mellitus (T2DM).
Using a cross-sectional study design, a retrospective analysis was conducted on postmenopausal female patients with T2DM who were hospitalized at Chu Hsien-I Memorial Hospital of Tianjin Medical University from September 2019 to December 2022. Serum uric acid levels and BMD of the lumbar spine, total hip, and femoral neck were collected. The patients were divided into four groups based on blood uric acid levels: T1 group (uric acid≤242.3 μmol/L), T2 group (242.3<uric acid≤288.2 μmol/L), T3 group (288.2<uric acid≤336.8 μmol/L), and T4 group (uric acid>336.8 μmol/L). According to the BMD results, the subjects were divided into normal bone mass group (T value≥-1), osteopenia group (-2.5<T value<-1) and osteoporosis group (T value≤-2.5). Comparisons between groups were conducted using analysis of variance (ANOVA), Kruskal-Wallis H test, or χ2 test. The correlation between blood uric acid and BMD was analyzed using a multiple linear regression model. Restricted cubic spline analysis was used to examine the relationship between blood uric acid levels and the occurrence of osteopenia/osteoporosis.
A total of 2 027 postmenopausal women with T2DM were included in the study. There were 507 cases in T1 group, 507 cases in T2 group, 508 cases in T3 group, and 505 cases in T4 group. There were 430 cases in the normal bone mass group, 1 117 cases in the osteopenia group, and 480 cases in the osteoporosis group. There were statistically significant differences in blood uric acid levels (H=1 899.375, P<0.001), as well as in lumbar spine BMD (F=5.979, P<0.001), total hip BMD (F=6.156, P<0.001), and femoral neck BMD (F=2.669, P=0.046) among the groups. The results of multiple linear regression analysis showed that after adjusting for multiple confounding factors, blood uric acid was still significantly correlated with lumbar spine (r=0.432, P=0.022) and total hip BMD (r=0.432, P=0.012). There was a statistically significant difference in blood uric acid between the normal bone mass group, the osteopenia group and the osteoporosis group (F=6.647, P=0.001). The results of restricted cubic spline analysis showed a dose-response relationship between blood uric acid and the occurrence of abnormal bone mass in postmenopausal women with T2DM (P-overall=0.012 8,P-nonlinear=0.899 1).When the serum uric acid concentration was below 288.071 7 μmol/L (OR=1.000 3, 95%CI 1.000 1-1.000 6, P-nonlinearity=0.899 1), the rate of occurrence of abnormal bone mass increased.
In postmenopausal women with T2DM, blood uric acid is positively correlated with BMD, and the decrease in serum uric acid levels is associated with the occurrence of reduced bone mass and osteoporosis in these patients.
To investigate the relationship between left atrial strain and microvascular complications in patients with type 2 diabetes mellitus (T2DM).
A total of 165 T2DM patients who admitted to in the Department of Endocrinology, the First Affiliated Hospital of Air Force Military Medical University from February to December 2023 were collected. The age, sex, duration of diabetes mellitus, use of rapid-acting insulin, use of long-acting insulin were collected, glycated hemoglobin A1c (HbA1c), total cholesterol (TC), urinary albumin to creatinine ratio (UACR) were detected, left ventricular global longitudinal strain (LVGLS), left atrial storage strain during reservoir phase (LASr), left atrial strain during conduit phase (LAScd), left atrial strain during contraction phase (LASct) were examined by two-dimensional spot tracking echocardiography. According to the number of microvascular complications of T2DM, the patients were divided into simple T2DM group (group A, 54 patients), T2DM with one complication group (group B, 69 patients), and T2DM with 2-3 complications group (group C, 42 patients). One-way analysis of variance was used to compare the baseline information, medication characteristics and biochemical indicators among the three groups. The relationship between left atrial strain parameters and microvascular complications of T2DM was evaluated by Spearman correlation analysis and logistic regression analysis.
The LASr, LAScd, and LVGLS of patients in group C were lower than those in group A and group B, and the LASr, LAScd, LASct, and LVGLS of patients in group B were lower than those in group A (P<0.05). Spearman correlation analysis showed that the microvascular complications of diabetes mellitus were negatively correlated with left atrial strain parameters LASr (r=-0.381, P<0.001) and LAScd (r=-0.385, P<0.001), but not with LASct (r=-0.151, P>0.05). Logistic regression analysis showed that, after adjusting for age, sex, duration of diabetes mellitus, use of rapid-acting insulin, use of long-acting insulin, HbA1c, TC, UACR, and LVGLS, compared with group A, LASr (OR=0.932, 95%CI 0.871-0.998), LAScd (OR=0.910, 95%CI 0.840-0.987) in group B and LASr (OR=0.886, 95%CI 0.799-0.983) and LAScd (OR=0.823, 95%CI 0.719-0.942) in group C were influencing factors associated with complications (P<0.05).
The number of microvascular complications in T2DM patients was negatively correlated with left atrial strain parameters LASr and LAScd.
To determine whether the hypoxia inducible factor-1α (HIF-1α)/platelet-derived growth factor receptor-β (PDGFR-β) signaling pathway is the mechanism by which Angelica dahurica stimulates angiogenesis and promotes angiogenesis and accelerates wound healing in type 2 diabetic mice.
A total of 48 spontaneous type 2 diabetic db/db male mice were randomly assigned to two groups using the random number table method: diabetic ulcer group (db/db group) and Angelica dahurica group (db/db+Angelica dahurica), with 24 mice in each group, 24 homologous db/m male mice of the same age were selected as the normal ulcer control group (db/m group). The skin ulcer model was prepared using a skin punch on the back of mice. The normal ulcer control group and the diabetes ulcer group received the same amount of normal saline by gavage, while the Angelica dahurica group received 1.8 g/kg of Angelica dahurica granules. The treatment was administered once daily for 11 consecutive days and the mice were euthanized for analysis at 1, 4, 7, and 11 days post-trauma. There were six mice in each group. HE and Masson staining were used to observe the histomorphologic changes of wound angiogenesis and collagen fiber formation. Western blotting, immunohistochemical staining, and immunofluorescence double staining were used to identify the expression of factors related to angiogenesis and neovascularization, such as phosphorylated phosphatidylinositol 3-kinase/phosphatidylinositol 3-kinase (p-PI3K/PI3K), phosphorylated protein kinase B/protein kinase B (p-AKT/AKT), HIF-1α, and PDGFR-β, in the wound tissues of db/db mice following Angelica dahurica intervention at the protein levels. Five groups were created from human brain microvascular pericytes (HBVP): control group, high glucose group, Angelica dahurica intervention group, high osmotic control group, and angelica dahurica+PI3K inhibitor (LY294002) intervention group. Before detecting the expression of the pericytes recruitment factor PDGFR-β, HIF-1α or pReceiver-M11-HIF-1α overexpression was silenced using PI3K inhibitor (LY294002) and HIF-1α-small interfering RNA (siRNA). Western blotting was used to detect the expression of HIF-1α, p-PI3K/AKT, and PDGFR-β. One-way analysis of variance was used to compare the groups.
According to the animal studies, the wound healing rate of the diabetic ulcer group was significantly lower than that of the normal ulcer control group at each time point (P<0.05). On the 4th, 7th, and 11th day after wounding, the Angelica dahurica group demonstrated improved wound repair and a shorter wound healing time than the diabetic ulcer group (P<0.05). Compared with normal ulcer control group, the positive expression of HIF-1α and PDGFR-β in the diabetic ulcer group was significantly decreased (P<0.05), while compared to the normal ulcer control group, the positive expression of HIF-1α and PDGFR-β in Angelicadahurica intervention group was significantly increased (P<0.05). The weekly cell experiment revealed that under high glucose and hypoxia conditions, there was a significant reduction in the expression of HIF-1α protein and nuclear translocation compared to the low glucose group (P<0.05). Angelica dahurica intervention group significantly increased nuclear translocation of HIF-1α, transcriptional activity, and HIF-1α protein level. Additionally, Angelica dahurica could activate the PI3K/AKT signaling pathway, and the application of PI3K inhibitor LY294002 could significantly inhibit HIF-1α and PDGFR-β protein expression in cells. Following the transfection of cells with HIF-1α-siRNA, it was found that PDGFR-β protein expression level significantly decreased, while overexpression of HIF-1α led to a corresponding increase in PDGFR-β expression (P<0.05).
Angelica dahurica promotes angiogenesis in diabetic wounds by activating PI3K/AKT, HIF-1α, and PDGFR-β signaling pathways.
The pathogenesis and complications of diabetes are diverse, involving genetic inheritance, environmental factors and lifestyle. Studies have pointed out that people with diabetes exhibit different clinical subtypes, prompting attempts to reclassify the disease. Through cluster analysis of clinical and genetic data, different type 2 diabetes subtypes have been identified that differ in disease progression and risk of complications. In addition, genes associated with diabetes risk were identified based on multi-omics data, particularly differences in genetic structure, further revealing the clinical heterogeneity of disease pathogenesis. Overall, accurate typing of diabetes will help to prevent, treat and manage this chronic metabolic disease more effectively.
Obesity has become a global trend. Compared with systemic obesity, the abnormal distribution of fat, such as abdominal obesity and increased visceral fat, are more related to the increased risk of metabolic diseases such as insulin resistance and type 2 diabetes. This review explores the mechanism of association between visceral fat and insulin resistance and type 2 diabetes, the effect of abnormal fat distribution on complications of type 2 diabetes, and introduces therapeutic drugs for type 2 diabetes with the potential to reduce visceral fat.
Metabolic diseases seriously affect global public health. Ferroptosis, a novel form of regulatory cell death, may be an important process that mediates the development of metabolic diseases. This article reviews the relationship and possible mechanism of metabolic diseases such as diabetes, metabolic-related fatty liver disease, osteoporosis, hypertension, obesity and iron death, so as to promote new clinical understanding of metabolic diseases and provide new targets for metabolic disease treatment.
Type 2 diabetes mellitus (T2DM) is a metabolic disease characterized by chronic hyperglycemia, which can cause chronic complications in the heart, nerves, blood vessels, kidneys, eyes, feet and other parts. Long chain non-coding RNAs (lncRNAs) can regulate gene expression at epigenetic, transcriptional and post-transcriptional levels. In the pathogenesis of T2DM and its complications, the study of molecular mechanisms related to lncRNA growth arrest specific gene 5 (GAS5) plays an important role. This article reviews the research progress of lncRNA GAS5 and T2DM and its chronic complications.
CURRENT ISSUE